Screaming Frog Response Time: What It Means
Screaming Frog's Response Time is the seconds to receive the first byte of each URL — server responsiveness, not full page speed. Sort it descending to find slow server responses at scale, then confirm real-world speed with the PageSpeed Insights integration or field data.
- Response Time ≈ time to first byte (TTFB): server + network, before any rendering.
- It is measured per URL during the crawl, so it varies with crawl speed and server load.
- Sort descending to triage — slow templates and heavy dynamic pages float to the top.
- It is not Core Web Vitals; connect the PSI API for LCP/CLS/INP data.
- Consistently high Response Time points at the server or CMS, not the front end.
Website loading speed isn’t just a number — it’s a key factor that directly affects user experience, audience retention, and even search engine rankings. The real challenge is how to quickly and accurately collect performance data to identify weak points and improve them. That’s where Screaming Frog comes in. This powerful tool easily integrates with the PageSpeed Insights API and gathers all the essential metrics needed to analyze your website’s page loading speed.
Connecting to the PageSpeed Insights API
To start analyzing page loading speed using Screaming Frog, you need to connect it to the PageSpeed Insights API. Follow these steps:
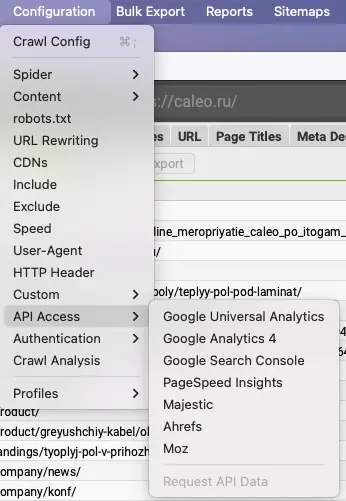
- Open Screaming Frog, then go to Configuration > API Access > PageSpeed Insights.
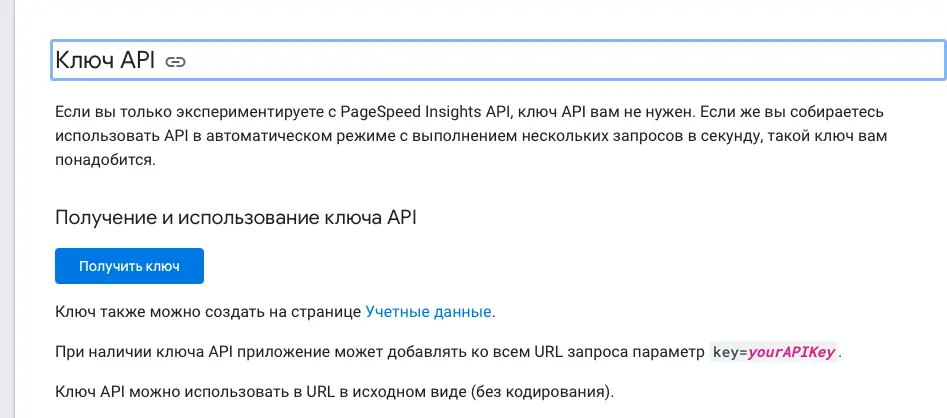
Enter the API key in Screaming Frog. Once you have obtained the key, enter it into the appropriate field in the Screaming Frog settings.
Confirm that the selected PageSpeed Insights configuration matches the test you intend to run before connecting.
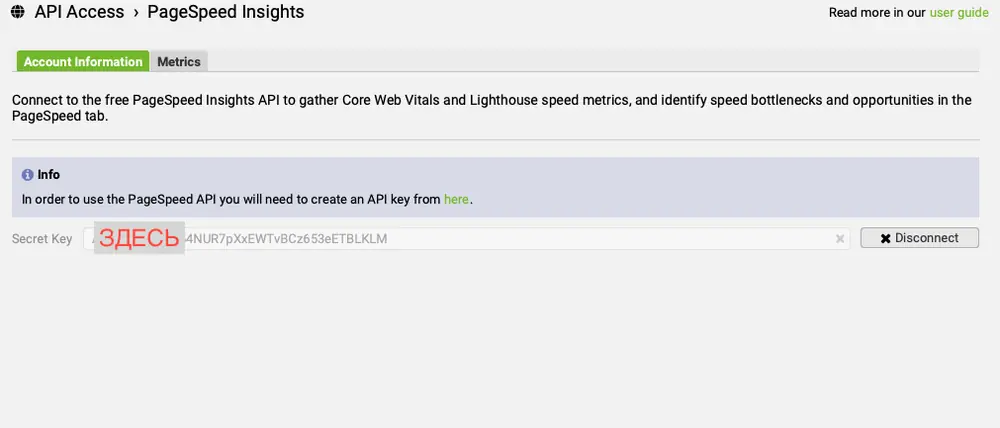
Click “Connect” to establish a connection with the PageSpeed Insights API.
Now Screaming Frog is ready to work with the API and can start collecting page performance data.
Setting Up PageSpeed Metrics in Screaming Frog

After connecting to the PageSpeed Insights API, the next step is to configure which metrics will be collected and analyzed. Screaming Frog provides a wide range of key performance indicators to assess your website’s speed and overall performance.
To configure the metrics, follow these steps:
Go to the Metrics tab in the PageSpeed Insights menu.
Select the metrics you want to analyze. The most important indicators for measuring site performance include:
Largest Contentful Paint (LCP) – measures how long it takes for the largest element on the page to load.
Cumulative Layout Shift (CLS) – tracks how much page elements shift during loading.
Interaction to Next Paint (INP) – measures the delay between user interaction and visual feedback.
If you want to use default settings, keep both CrUX (Chrome User Experience Report) and Lighthouse lab dataenabled.
You can also customize additional parameters, such as request limits or selecting specific pages for analysis.
These metrics provide a comprehensive understanding of your site’s loading quality and user engagement. Configuring them helps identify which aspects need improvement — whether it’s content rendering speed or layout stability. Once your settings are complete, start crawling your website.
Analyzing the Results
After Screaming Frog finishes crawling your site and collecting data through the PageSpeed Insights API, it’s time to analyze the results. The tool allows you to easily review the performance of each page using a range of key metrics.
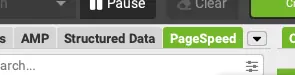
Viewing PageSpeed Data in Screaming Frog
Open the PageSpeed tab in Screaming Frog — here you’ll find all the data collected for each crawled page.
Review Core Web Vitals metrics. Scroll the table to the right to see key indicators such as:
Largest Contentful Paint (LCP) — measures how long it takes for the main content to load.
Cumulative Layout Shift (CLS) — reflects the visual stability of the page during loading.
Interaction to Next Paint (INP) — shows the delay between user interactions and page response.
Performance assessment. Pay attention to the Core Web Vitals Assessment column, which provides an overall performance evaluation for each page. The values can be:
Passed — the page meets Google’s performance standards.
Failed — the page requires optimization.
Additional metrics. Use other data points, such as rendering speed, blocking resources, or server response time, to gain a more complete picture of your website’s performance.
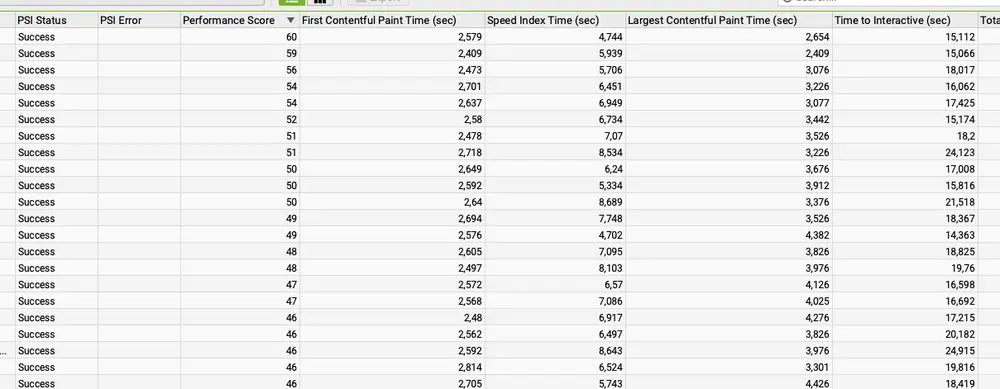
Analyzing PageSpeed Data
Analyzing this data helps identify the pages that need improvement to meet Core Web Vitals standards and boost your website’s overall loading speed.
Identifying Performance Issues
Once you’ve reviewed the scan results, the next step is to pinpoint specific issues that may be slowing down your website. Screaming Frog offers several tools to help with diagnostics and optimization. Here’s how to do it:
Use filters to detect issues:
Go to the PageSpeed tab and apply filters to sort pages by performance.
Filter out pages with poor metrics — such as high Largest Contentful Paint (LCP) or significant Cumulative Layout Shift (CLS) — to focus on the ones that need attention first.
Pay attention to common issues:
Reduce Server Response Time – a slow server response can negatively impact page load times.
Eliminate Render-Blocking Resources – blocking scripts such as JavaScript and CSS can delay rendering.
Properly Size Images – oversized images can significantly increase loading time.
Defer Offscreen Images – images outside the visible area can be deferred to speed up the initial load.
Use the “Opportunities” tab:
Go to the Opportunities tab, where Screaming Frog provides actionable recommendations for fixing detected problems.
Follow the suggestions to identify which resources or elements are slowing your pages down.
Apply a combined approach:
Analyze not only lab data, but also field data from the Chrome User Experience Report (CrUX), which reflects real-world user experience.
Evaluate how different devices and connection speeds affect your website’s performance.
Identifying and resolving these issues can significantly improve page loading speed, enhancing both user experienceand SEO performance.
Conclusion
Using Screaming Frog together with the PageSpeed Insights API makes the process of analyzing page loading speed simple and automated. By configuring metrics, running scans, and reviewing the results, you can uncover the key performance issues that slow down your site. These insights allow you to take timely optimization actions, improving user experience and boosting your search rankings.
Remember — regular monitoring and fixing detected issues will help your website maintain top performance across all key metrics.
Is Screaming Frog Response Time the same as page load time?
Why does Response Time vary between crawls?
How do I get Core Web Vitals in Screaming Frog?
What counts as a slow Response Time?
Sources
- Screaming Frog SEO Spider: configuration guide, including crawl and API settings.
- Screaming Frog: auditing Core Web Vitals with PageSpeed Insights.
- web.dev: Web Vitals, definitions and current thresholds for field metrics.